
Google replaced its long-standing integrity protection with the Safetynet infrastructure in 2024, with a new structure called PairIP. When you enter the Safetynet documentation page, you will see the warning “Warning: The SafetyNet Attestation API is deprecated and has been replaced by the Play Integrity API. Learn more.”
So what is this PairIP? What are the differences between it and Safetynet? Let’s take a look at this.
0x00: Safetynet Workflow
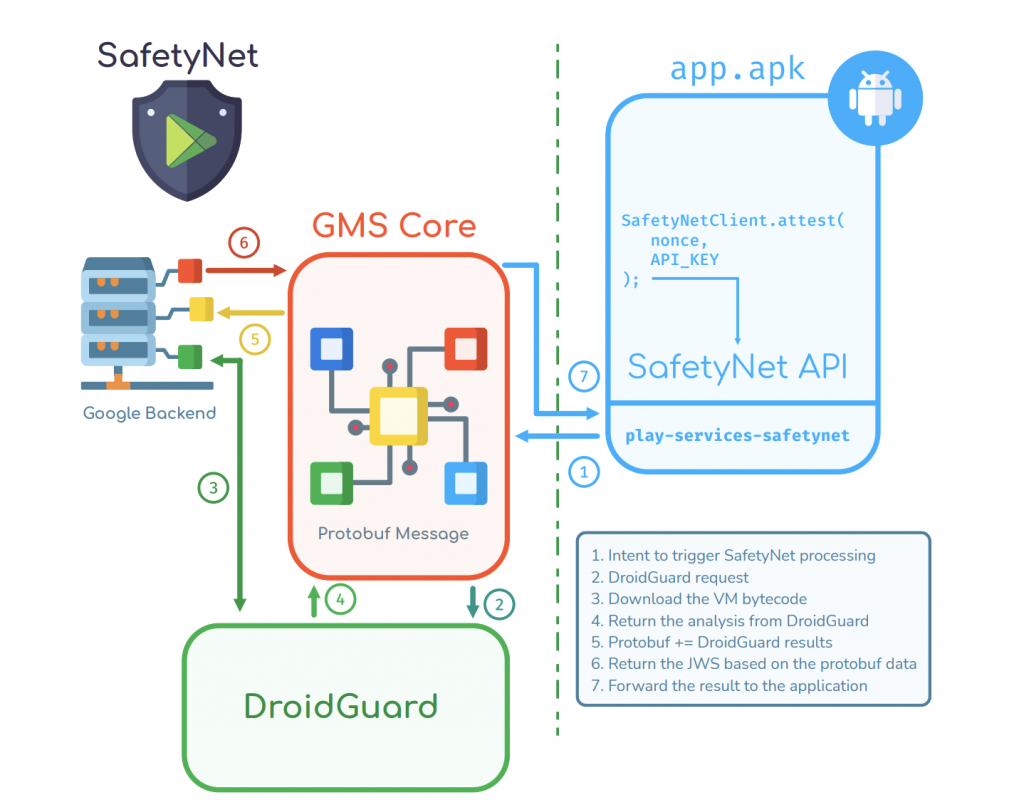
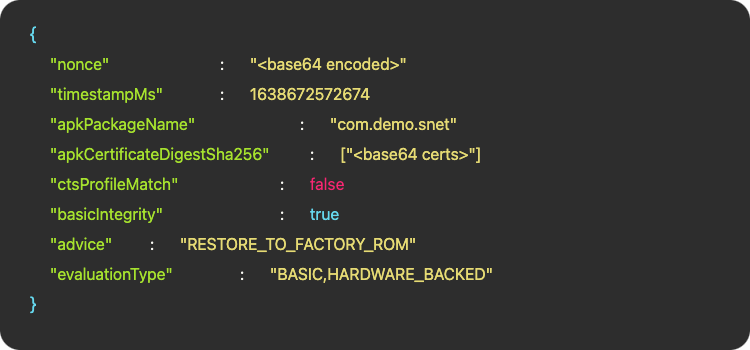
SafetyNet is a security mechanism that includes a virtual machine module called DroidGuard, which is part of the Google Mobile Services (GMS) package. This VM executes specific bytecode to analyze the device’s security status. The client application generates a nonce token, which is included in the attestation request sent via the Attestation API. The response from this API provides two parameters: ctsProfileMatch and basicIntegrity, which help assess the device’s compatibility and integrity.
CTS Profile Match: bootloader unlocked?, custom ROM?, uncertified device? etc..
Basic Integrity: is an emulator?, rooted device?, any agent injected? (frida etc..) etc..
At the end of the security checks performed by DroidGuard, a Protobuf message is generated. This message contains many parameters related to the device’s security checks. The ctsProfileMatch and basicIntegrity parameters mentioned above are also generated as a result of these checks. After all the checks are completed, Google’s backend issues a JWS token that includes all this data.
You can view the DroidGuard protobuf schematic here;
https://github.com/microg/GmsCore/blob/ad12bd5de4970a6607a18e37707fab9f444593a7/play-services-core-proto/src/main/proto/snet.proto#L15-L25
in short, safetynet works like this:
SafetyNet’s Detection Logic
- Relies on two layers of checks:
- Quick and simple checks (e.g., detecting
subinaries, checking SELinux status) - More in-depth, resource-intensive checks performed by DroidGuard
- Quick and simple checks (e.g., detecting
DroidGuard
- Runs a custom virtual machine (VM) that executes proprietary bytecode from Google
- Collects detailed security information (e.g., ROM status, bootloader state, injected agents)
- Prepares a Protobuf message summarizing the device’s security state
Attestation Process
- The client application generates a nonce (unique token) and sends it, along with DroidGuard’s security data, to Google’s backend
- Google analyzes the data and determines
ctsProfileMatch(checks for unlocked bootloader, custom ROMs, etc.) andbasicIntegrity(detects emulators, root access, or code injection)
Final Token Generation
- After analysis, Google’s backend creates a JWS (JSON Web Signature) token containing all attestation results
- This token is not generated on the device but on Google’s servers, ensuring integrity and authenticity
now that we’ve said goodbye to Safetynet, let’s talk a little bit about PairIP.
0x01: PairIP Protection Workflow
PairIP has similar mechanisms to Safetynet as basic checks. It subjects your device to a security check by performing an integrity check on the device. However, unlike Safetynet, it does not require an additional Attestation or a different module.
PairIP basically uses a native library to perform integrity checks. This library separates some of the java codes in the project from their own lifecycle and allows them to be executed through the native library.
This library, called libpairipcore.so, is a powerful library that works on a VM basis and uses many anti-tampering techniques. It separates the java bytecodes in the project from the main structure of the project and converts them into bytecodes that will run in its own VM. Instead of running java bytecode directly in the project, some codes are run in this VM developed by Google via pairip’s executeVM() method.
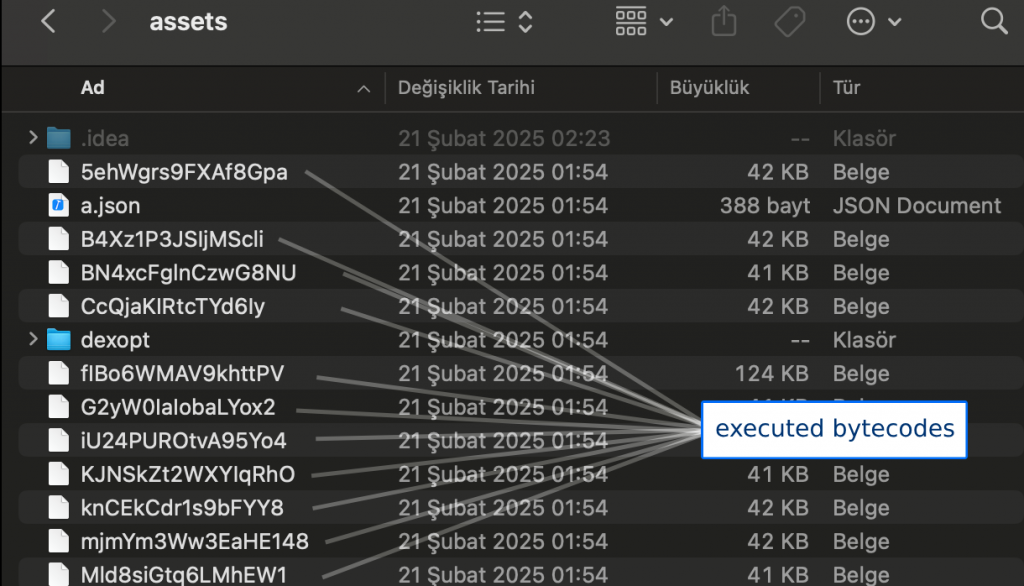
These bytecode files in the assets/ folder in your application are converted into meaningful bytecodes by the VM and executed by the executeVM method. This is not a method defined in the executeVM native library. It is stored in JNI_OnLoad via RegisterNatives. and some method calls belonging to the library, important strings and many other things are created at runtime. So , if we want to do a complete analysis and examine the executeVM() method, we will first need to dump the library created at runtime.
So, how did we find the executeVM() method? Let’s take a closer look.
0x02: Introduction to Libpairipcore.so
The VMRunner class on the Java side is the main class that manages all the checks that PairIP performs within the application. This class manages all processes such as reading VM bytecodes from the assets/ folder and transferring the read bytecodes to the executeVM() method.
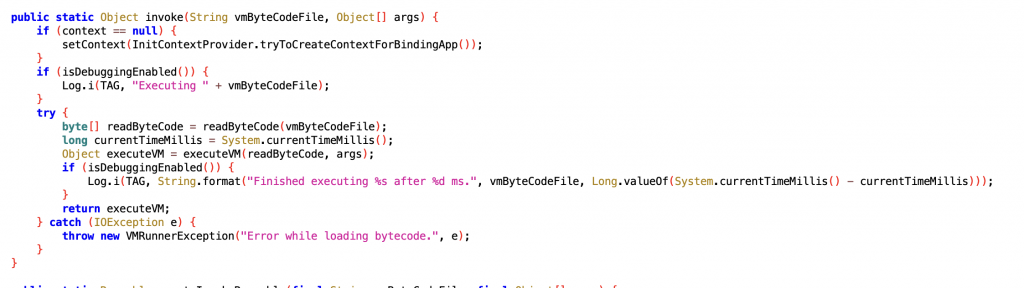
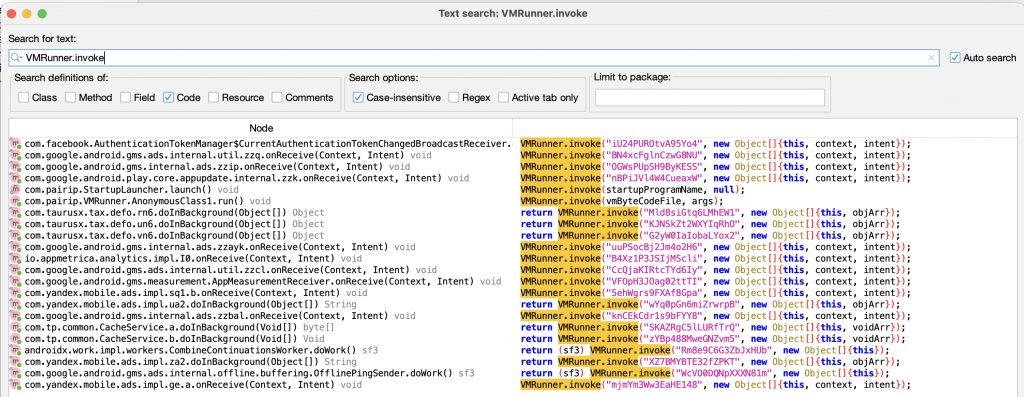
As can be seen, VM bytecodes are read with the readByteCode() method and then the read bytecode is transferred to the executeVM() method. When we look at the call tree of the invoke() method, we can see that there are many calls belonging to many packages.
PairIP splits the code into different parts by adapting the native code to its own VM structure and allows the calls to become more complex. The parameters we see in the invoke() call here correspond to the names of the bytecode files in the assets/ folder.
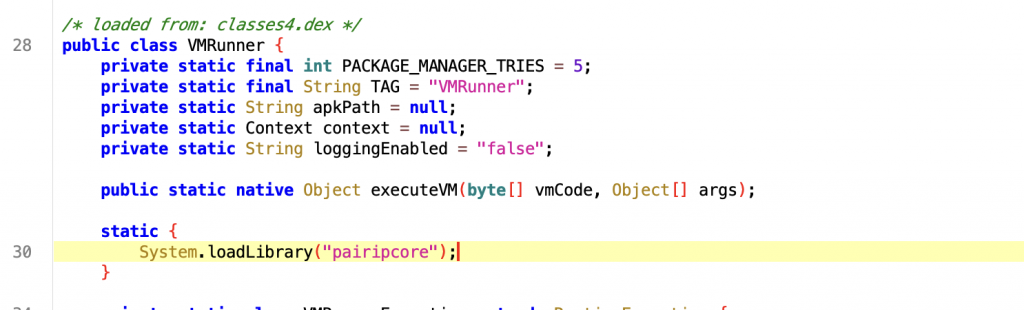
When we look at the codes, we see that the executeVM() method is defined on the native side. And when we examine the library from ghidra, we know that this method is not defined directly, but may have been registered via RegisterNatives.
If you want to take a look at the JNI_OnLoad method to follow the RegisterNatives call, you may not see a direct RegisterNatives call, but you may find some helpful hints.
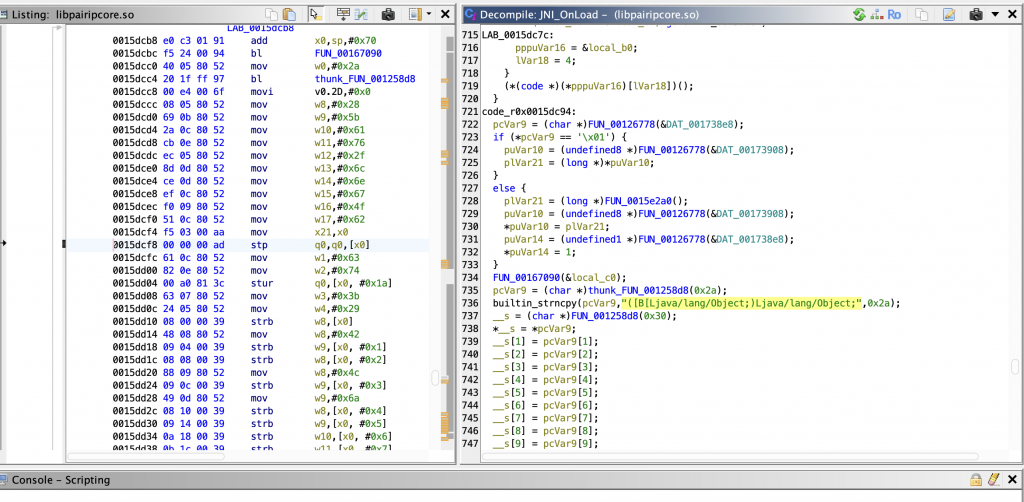
When you examine it with Ghidra, we can see that there is a field in JNI_OnLoad where a method is defined. When we compare its parameter array with the values we get from Java, we can easily see that it matches the executeVM() method.
Therefore, the registration process of the executeVM() method may be taking place here. In that case, if we find the offset of the RegisterNatives call in the native library, we can reach the executeVM method by following this call.
Everyone can do this in different ways. In my own analysis process, I used Frida’s Stalker API to analyze the instructions more easily and speed up the patch process.
The operations we will do here will be as follows;
- Finding the offset address of the RegisterNatives call
- Finding the location of the executeVM() method in memory by hooking the offset found
- Dumping the real libpairipcore.so file modified in the runtime
- Analyzing the executeVM() call by examining the offset found in the dumped library.
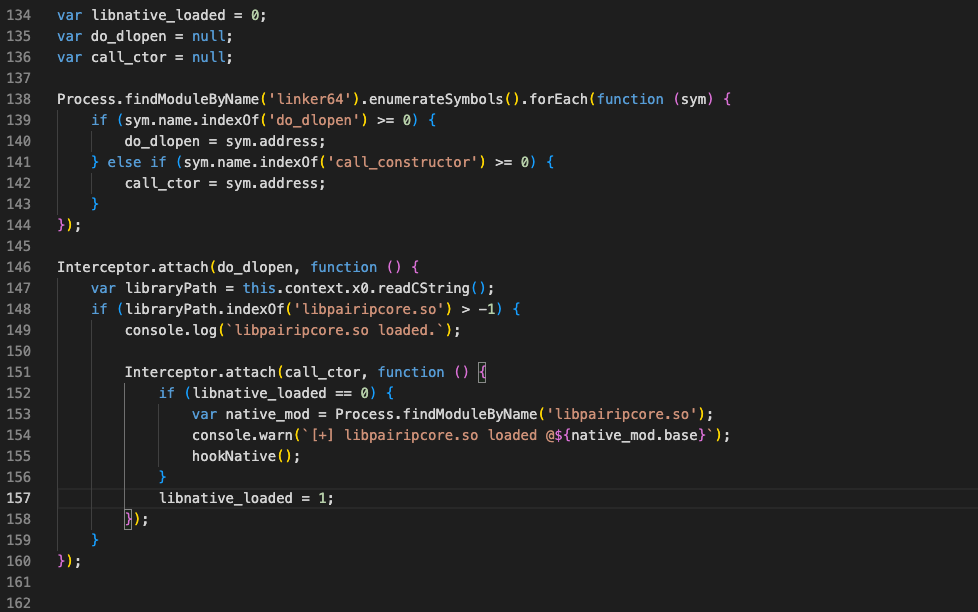
we intercept the dlopen method to hook the libpairipcore.so file as soon as it is loaded and run the desired hook method as soon as the loaded library name is equal to the “libpairipcore.so” string.
function startStalker(threadId, targetModule) {
    Stalker.follow(threadId, {
        transform: function (iterator) {
            var instruction;
            while ((instruction = iterator.next()) != null) {
                if (instruction.address <= targetModule.base.add(targetModule.size) &&
                    instruction.address >= targetModule.base) {
                    var offset = instruction.address.sub(targetModule.base);
                    console.log(`[+] ${offset}: ${instruction.toString()}`);

                    iterator.putCallout(function (context) {
                        console.log(`    x8=${context.x8.toString(16)}`);
                        console.log(`    x0=${context.x0.toString(16)}`);

                        var moduleDetails = Process.findModuleByAddress(context.x8);
                        if (moduleDetails) {
                            console.log(`    Module: ${moduleDetails.name}`);
                            console.log(`    Base: ${moduleDetails.base}`);
                            console.log(`    Offset in module: 0x${context.x8.sub(moduleDetails.base).toString(16)}`);

                            var symbol = DebugSymbol.fromAddress(context.x8);
                            if (symbol && symbol.name && symbol.name.indexOf("0x") == -1) {
                                console.log(`    Symbol: ${symbol.name}`);
                            }
                        }
                    });


                }
                iterator.keep();
            }
        }
    });
}

function stopStalker(threadId) {
    Stalker.unfollow(threadId);
    Stalker.flush();
}
We simply create our methods using the Stalker API. This structure provides a framework that allows us to intercept all instructions from the moment the application is started. Here we can do instruction-based filtering and hook only the instructions we want. However, seeing the entire flow at the beginning seems like the most logical way to go for me.
if (instruction.mnemonic.startsWith('bl') || instruction.mnemonic.startsWith('b.')) {
//other codes..
}
Here, while the instructions are being loaded, we are monitoring the x8 and x0 registers in the same loop. The x0 register allows us to obtain the first parameter passing the function. The x8 register represents the branch target address. If the target offset belongs to a module, we obtain the information about the module and perform a more detailed analysis.
if this address is within a module range, we print its details to the console. if there is any symbolic variable or function-like definition at this address, we also print this symbolic data.
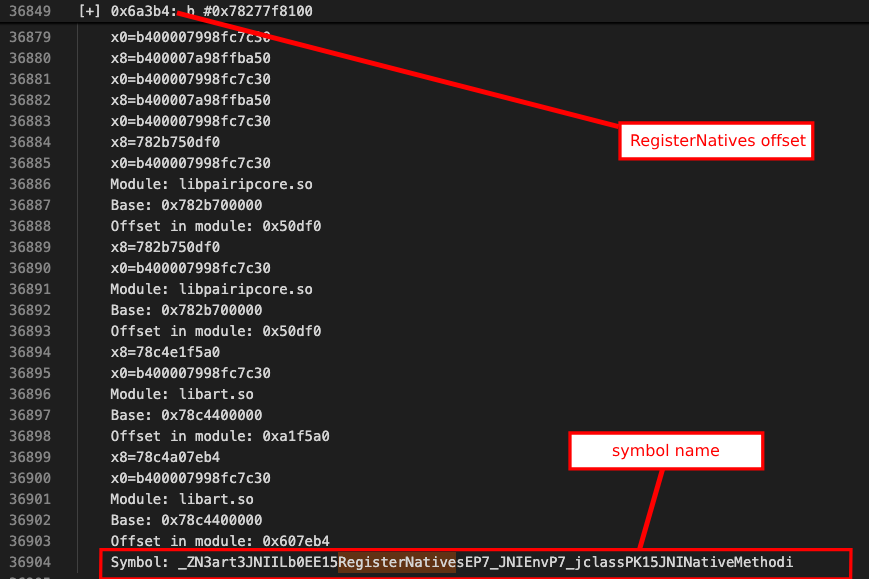
In the script we ran, we caught the RegisterNatives call in the unconditional branch line and obtained information such as offset and symbol name. Using this offset, we can catch the register natives calls and find the real address of executeVM. Let’s modify the script a little more.
function hookNative() {

    const jniOnLoad = moduleHandle.findExportByName("JNI_OnLoad");
    if (!jniOnLoad) {
        console.log("[-] JNI_OnLoad not found!");
        return;
    }

    console.log("[+] JNI_OnLoad founded:", jniOnLoad);

    var hook3 = Interceptor.attach(jniOnLoad, {
        onEnter: function(args) {
            console.log("[+] JNI_OnLoad called");
            console.log("JavaVM pointer:", args[0]);
            console.log("reserved:", args[1]);

            console.log("Backtrace:\n" + Thread.backtrace(this.context, Backtracer.ACCURATE)
                .map(DebugSymbol.fromAddress).join("\n"));

            startStalker(this.threadId, Process.getModuleByName('libpairipcore.so'));
        },
        onLeave: function(retval) {
            console.log("[+] JNI_OnLoad return value:", retval);
            stopStalker(this.threadId);
            hook3.detach();
        }
    });


    const moduleHandle = Process.findModuleByName('libpairipcore.so');
    if (!moduleHandle) {
        console.log("[-] libpairipcore.so not found!");
        return;
    }

    const registerNativesOffset = moduleHandle.base.add(0x6a3b4);
    Interceptor.attach(registerNativesOffset, {
        onEnter: function(args) {
            console.log("[+] RegisterNatives called");
            console.log("    JNIEnv*:", this.context.x0);
            console.log("    jclass:", this.context.x1);
            console.log("    JNINativeMethod*:", this.context.x2);
            console.log("    nMethods:", this.context.x3);

            const nMethods = this.context.x3.toInt32();
            const methods = this.context.x2;

            for(let i = 0; i < nMethods; i++) {
                const methodInfo = methods.add(i * Process.pointerSize * 3);
                const name = methodInfo.readPointer().readCString();
                const sig = methodInfo.add(Process.pointerSize).readPointer().readCString();
                const fnPtr = methodInfo.add(Process.pointerSize * 2).readPointer();
                const ghidraOffset = ptr(fnPtr).sub(moduleHandle.base).add(0x00100000);

                console.log(`    Method[${i}]:`);
                console.log(`        name: ${name}`);
                console.log(`        signature: ${sig}`);
                console.log(`        fnPtr: ${fnPtr}`);
                console.log(`        ghidraOffset: ${ghidraOffset}`);
                console.log(`        Ghidra offset: 0x${ghidraOffset.toString(16)}`);

                console.log(`[+] ${name} function's memory dump:`);
                const dumpSize = 128;
                const dumpData = Memory.readByteArray(fnPtr, dumpSize);
                console.log(hexdump(dumpData, {
                    offset: 0,
                    length: dumpSize,
                    header: true,
                    ansi: false
                }));
            }
        },
        onLeave: function(retval) {
            console.log("[+] RegisterNatives finished, return value is:", retval);
        }
    });

}
We intercept the offset we received from Stalker and reach the original RegisterNatives call. We print the details of the call we obtained from the registers. (x0,x1,x2)
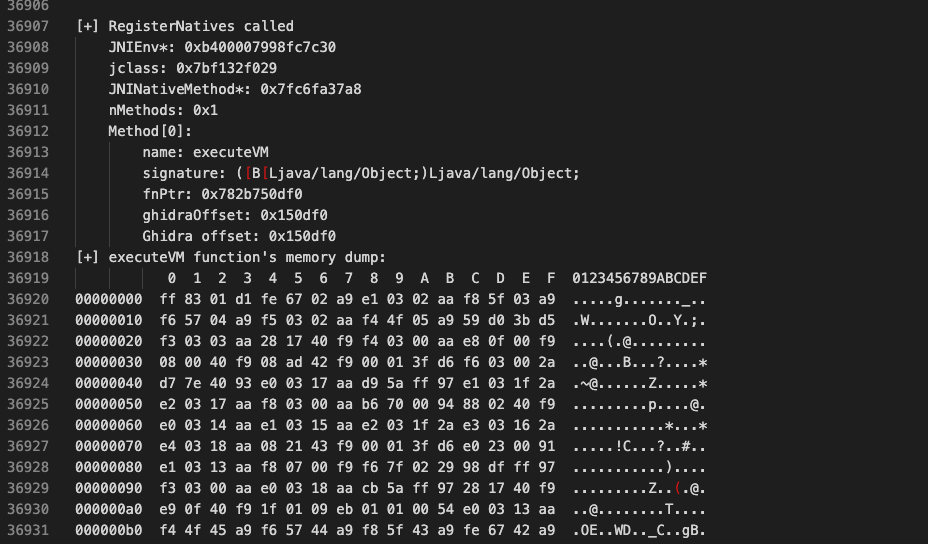
    Method[0]:
        name: executeVM
        signature: ([B[Ljava/lang/Object;)Ljava/lang/Object;
        fnPtr: 0x782b750df0
        ghidraOffset: 0x150df0
        Ghidra offset: 0x150df0
Yes! we have enough data for now. there are many methods on how to dump the library running at runtime, I will not go into detail on how to do this in order not to extend the topic further. since you know the starting address of the function, you can do this using Frida’s Memory API or various Dumper tools.
Of course, analyzing this method will not be easy, as you can imagine. You will need to spend some time with control-flow obfuscation and some time with the instruction set. In order to fully understand how the bytecodes are processed, we need to fully define the opcodes used. Now let’s dig a little deeper;
0x03: Deeper Analysis
If you have successfully dumped the library in the runtime and correctly obtained the memory address of the executeVM method, we can take a closer look at Google’s VM structure.
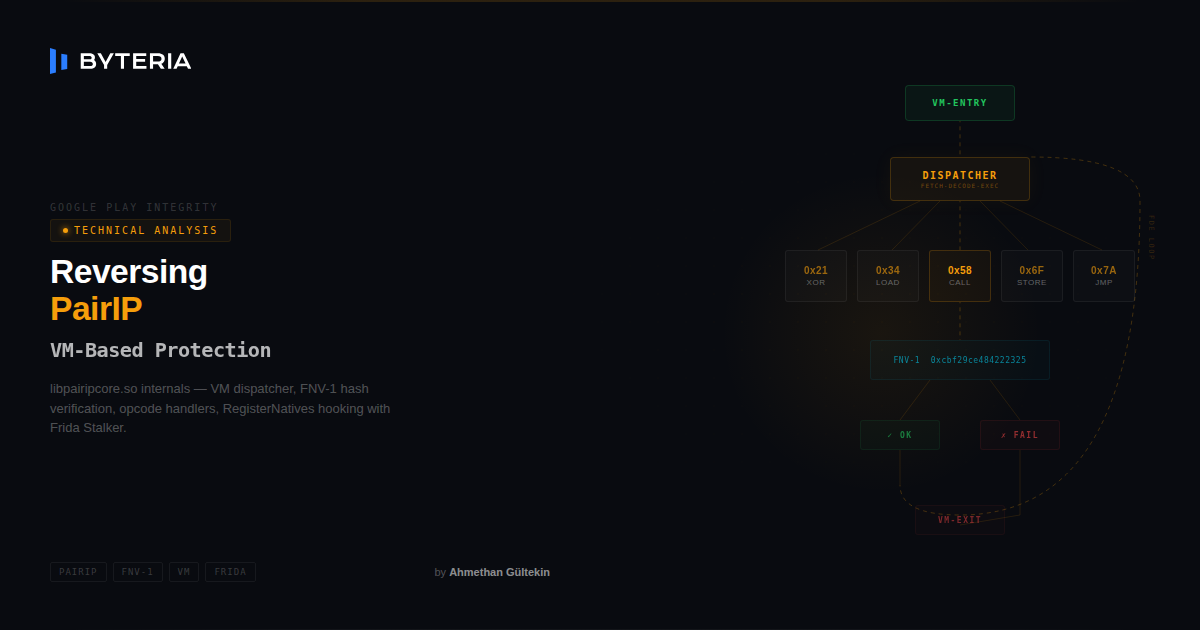
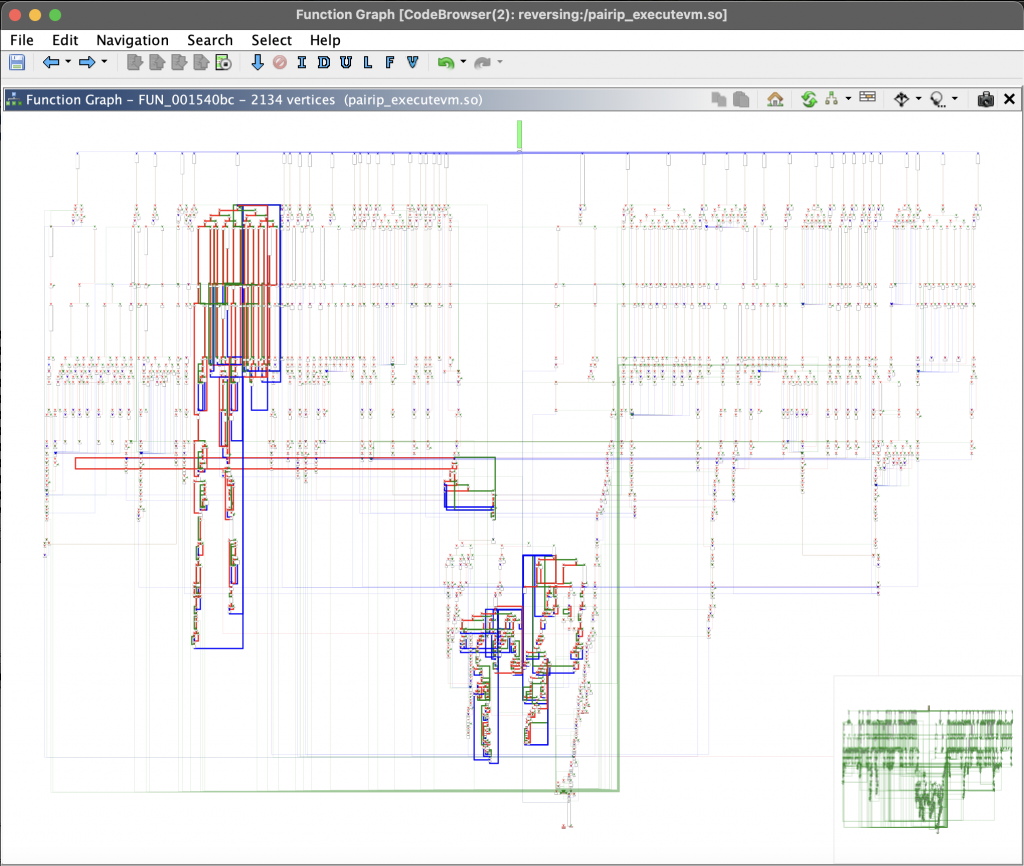
The image you see above is a graphic of where all the operations you will encounter when you go to the memory address of the executeVM() method are executed. When you look at this structure, you will notice that you are facing a VM-based structure. If you haven’t, I recommend you to review the article Writing Disassemblers for VM-based Obfuscators by Tim Blazytko. Let’s briefly summarize the parts of this article that will be useful to us.
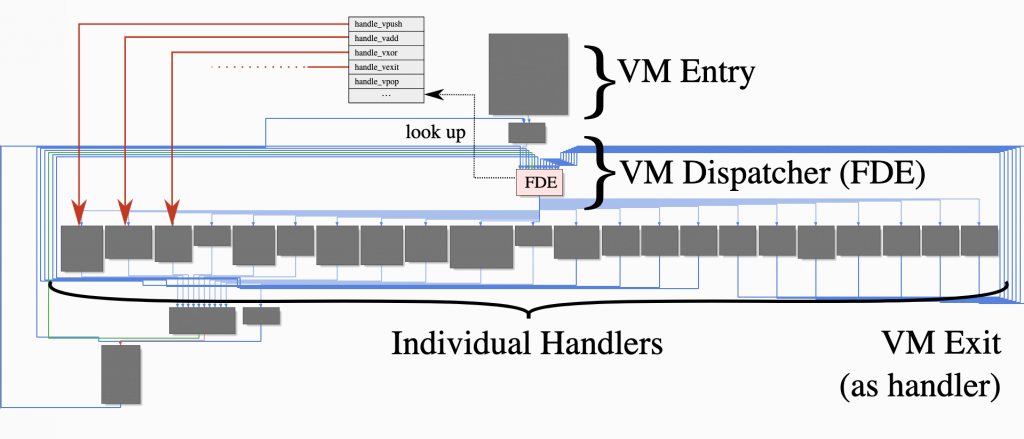
VMs basically consist of a few elements. In the VM-entry section, the necessary context for the VM is prepared; for example, registers are set, the bytecode address is determined. The green block at the top of our graph view is our VM-entry section.
FDE (Fetch-Decode-Execution): It is the cycle in which the main operations related to the program are managed. The opcode corresponding to the operation to be performed is retrieved from memory (often via a Program Counter, PC) and decoded to find the actual instruction corresponding to this opcode. During decoding, the opcode is usually controlled and decoded using a switch-case or similar if-else block. The instruction found at the end of this decoding step is then executed, and the PC is updated accordingly. Thus, this cycle (Fetch-Decode-Execute) is repeated for each subsequent opcode until the program terminates or an exit condition is reached.
The structure we call VM-dispatcher is the main switch structure that manages this FDE cycle.
Handler functions are structures that implement these opcode instructions.
The VM-exit section is where you return to normal code when the code process is finished or the last instruction is executed.
To give an example of the structures we mentioned from the library in front of us, the green block at the top is our VM-Entry block.
The yellow marked block just below is the area we call Dispatcher Loop. To understand this, if we look at the switch-case block in the psuedo code section, we can see that there is a main large switch mechanism and that opcode decoding is performed in the branching case structures underneath (the FDE structure we just mentioned). The case controls in this dispatcher loop are transmitted to the Opcode Handlers located next to each other in the chart.
After this decoding process is completed, the instructions corresponding to the opcode are executed and after the process is completed, the VM exit is made from the exit point. This process is repeated for each opcode.
If we look at these handlers a little more closely, we can find some interesting things within the case blocks.
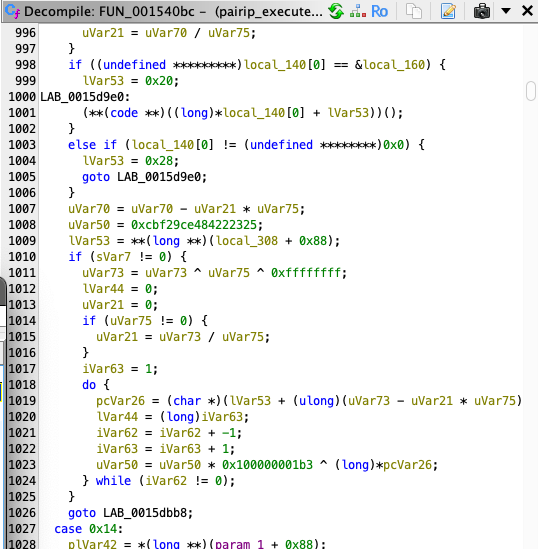
here when we examine all the handlers we will see some operations (like XOR) and some hash operations as repeated constants.;
uVar50 = 0xcbf29ce484222325;
...
uVar50 = uVar50 * 0x100000001b3 ^ (long)*pcVar26;
The values here can give us some ideas about how the bytecodes are executed. If the value 0xcbf29ce484222325 does not seem familiar to you, let’s explain it quickly. This value refers to the FNV-1 hash operation.
The hash value is initialized with a specific “offset basis”. For 64 bits this is typically 0xcbf29ce484222325.
FNV-1 works as follows:
hash = hash * FNV_PRIME
hash = hash ^ (data_byte)
the prime value is used as constant 0x100000001b3 in all opcode handlers. Therefore, our initialize hash value and prime value are constant for all opcode handlers.
where it simply multiplies the hash value by the prime value and then XORs the target data with this value to complete the FNV-1 hash process. here we have the first point where we can get an idea about how bytecodes are executed.
0x04: Opcodes
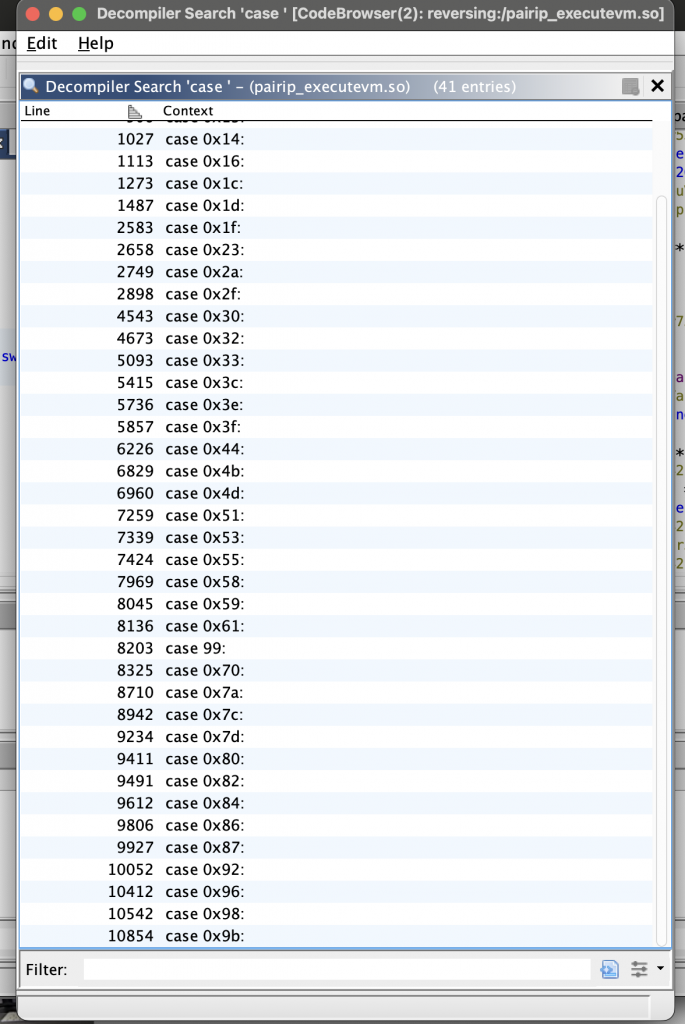
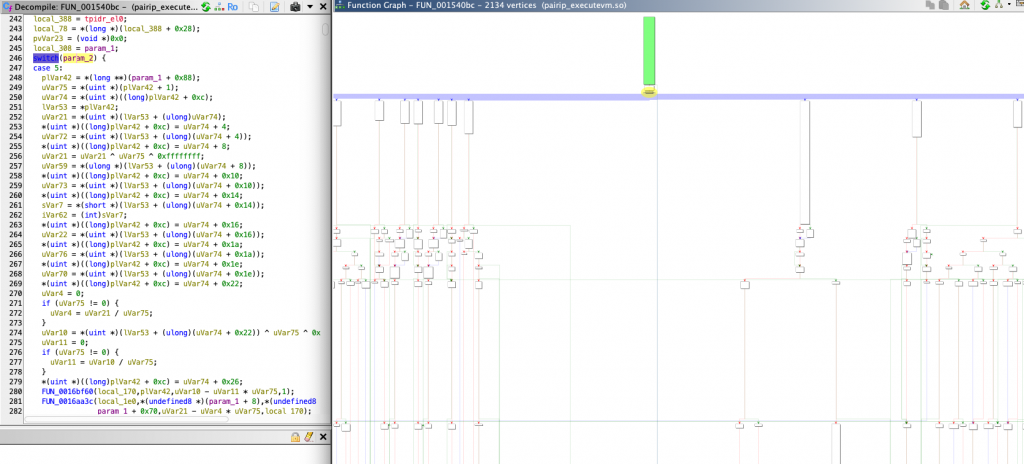
When we look at the executeVM offset where all operations are executed, we see plenty of switch-case blocks. With these case blocks, the tasks of the opcodes are allocated and each opcode has 2 different addresses for successful / unsuccessful cases. let’s do a little analysis by considering opcode 0x58.
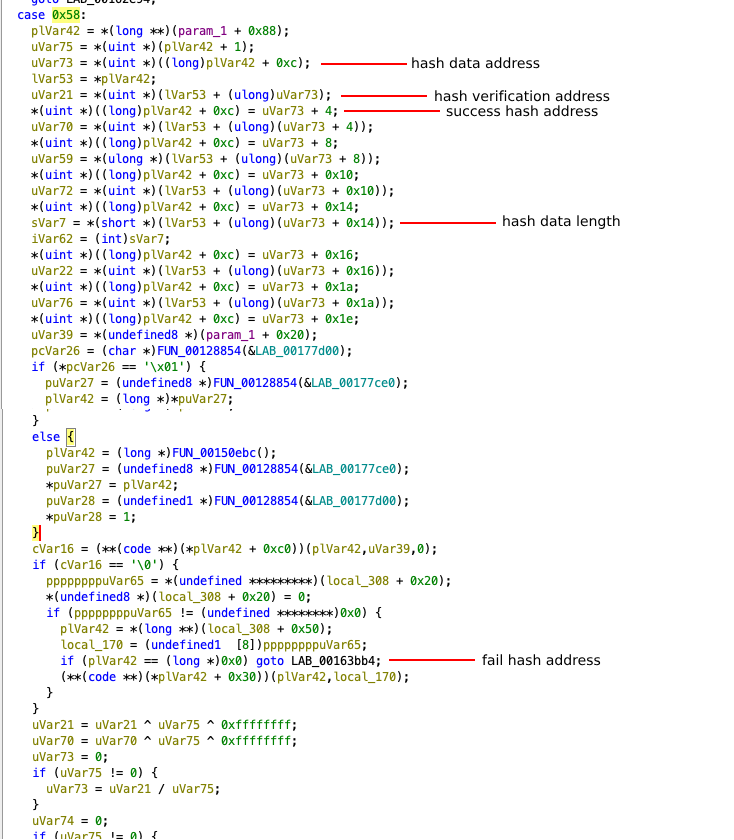
Each opcode checks the validity of the data using the FNV-1 hash algorithm in the verification step. If the hash verification is successful, the transaction is directed to the successful address. If the verification fails, it is directed to the fail address.
As seen in the pseudocode, each opcode contains 2 addresses. If an external modification is made to the opcode, the FNV-1 hash verification will always redirect execution to the fail address. This mechanism introduces uncertainty and enhances the security of the VM.
in short, before performing the opcode task, the following steps are followed;
- The data required for hash verification is read from memory.
- The hash length is determined to specify how many bytes will be used for verification.
- The expected hash value is retrieved from memory for comparison.
- Verification is performed using the FNV-1 hash function.
- If the computed hash matches the expected value, execution proceeds to the success address.
- If the computed hash does not match, execution jumps to the fail address.
As evident from these processes, the VM developed by Google follows a stack-based execution model, although it does not utilize a traditional hardware stack. Instead, it manages data through memory operations that resemble stack behavior. Each opcode retrieves, updates, and manipulates values within a structured memory region, mimicking the functionality of a stack without explicitly relying on push/pop instructions or a dedicated stack pointer. This design eliminates the need for a large number of explicit registers and provides a more flexible execution flow while ensuring controlled memory access through hash verification mechanisms.
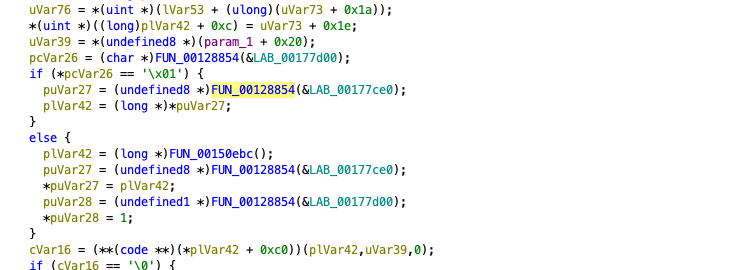
After all these calculations are completed, the opcode calls the function that will perform its main function. If we proceed from the 0x58 opcode, we see that it calls the FUN_00128854 function with different parameters according to the calculated values. Let’s examine this method closely.
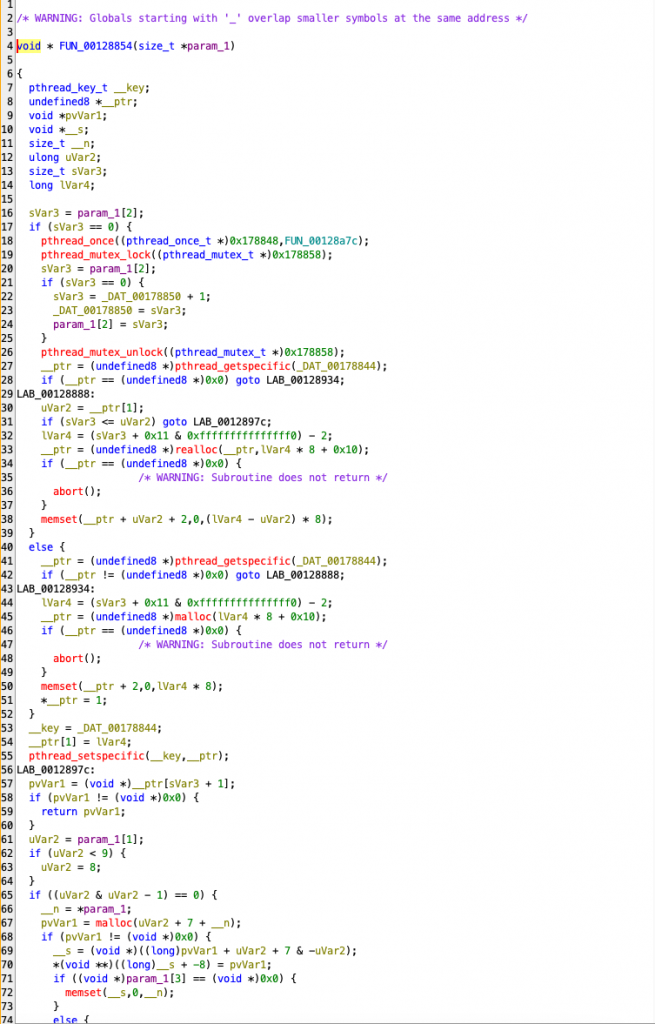
pthread_ methods have caught your attention. In this method, it is simply checked with pthread_getspecific() whether this memory area has been allocated before. If it has not been allocated, this area is allocated with malloc() and its usage continues. If this area has already been allocated, it continues to use the existing memory. It also prevents more than one thread from allocating the same space with the pthread_mutex_lock() and pthread_mutex_unlock() methods.
If the currently allocated area is smaller than the area of the memory that is desired to be used, the existing area is expanded with realloc().
| Code Line / Function | Functionality | Description |
|---|---|---|
pthread_once(FUN_00128a7c) | One-time initialization | Ensures that global configuration or memory settings are executed only once. |
pthread_mutex_lock() | Synchronization | Acquires a lock to prevent race conditions when multiple threads try to access memory. |
sVar3 = param_1[2]; | Memory ID check | Checks if a unique ID has been assigned to the thread. |
pthread_getspecific(_DAT_00178844); | Check existing memory | Determines if a thread-specific memory block has already been allocated. |
malloc(lVar4 * 8 + 0x10); | New memory allocation | Allocates a new memory block if no previous allocation exists. |
realloc(__ptr, lVar4 * 8 + 0x10); | Expand memory | If existing memory is insufficient, it expands the allocated space using realloc(). |
memset(__ptr + 2, 0, lVar4 * 8); | Initialize memory | Clears the allocated memory for security and stability. |
pthread_setspecific(__key, __ptr); | Save thread-specific memory | Stores the allocated memory block for the thread so it can be accessed later. |
return pvVar1; | Return allocated memory | The thread can now use its assigned memory block. |
pthread_mutex_unlock(); | Release lock | Allows other threads to access memory once allocation is complete. |
We can simply analyze opcodes this way. But since opcodes change during each compilation, there is no way to decode them as a fixed opcode. This can be a bit of a tiring task as it has to be analyzed from scratch each time.
0x05: Bytecode Analyze
Since the general working principle of the executeVM method is based on running the VM bytecodes in assets/, we first need to make sense of these files.
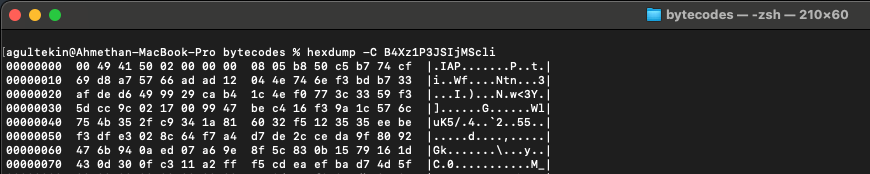
When you examine each bytecode as hex, you will often see the .IAP magic. This is not important because this magic is done by skipping the first 8 bytes when reading this bytecode in the library.
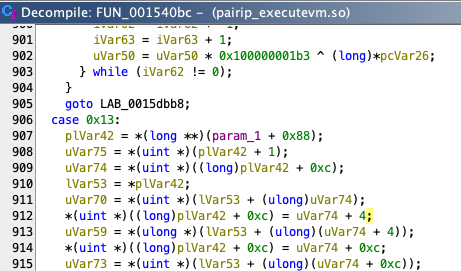
*(uint *)((long)plVar42 + 0xc) = uVar74 + 4;If you examine the switch-case blocks carefully, you will notice that some operations repeat consistently. For example, when analyzing these lines inside the executeVM method, you can see that it reads memory by skipping 2, 4, or sometimes 8 bytes at a time.
uVar21 = *(uint *)(lVar53 + (ulong)uVar74);
uVar21 = uVar21 ^ uVar75 ^ 0xffffffff;
This suggests that specific values are consistently XORed with 0xffffffff and that mathematical operations involving offsets are applied. These processes are common across multiple handlers, suggesting a pattern in the VM’s execution flow. (what a great luck!)
puVar27 = (undefined8 *)(*(long *)(local_308 + 0x70) +
               (ulong)(ushort)(uVar6 ^ (ushort)uVar21 ^ 0xffff) * 0x10);
Here, the VM computes an address by XORing specific values and applying an offset, indicating a structured approach to memory access.
The VM searches for a potential key by scanning memory in fixed increments, reading values at specific offsets. It identifies possible key locations by extracting values from memory and applying a series of transformations.
Once a potential key address is found, the VM reads a 16-bit value to determine the key length. This helps define the portion of memory that will be processed.
sVar7 = *(short *)(lVar53 + (ulong)(uVar74 + 0x14));
iVar62 = (int)sVar7;
After extracting the relevant data, the VM applies an XOR operation to modify the retrieved value. This transformation reverses obfuscation or encryption applied to stored data. To ensure the extracted data is valid, the VM computes a FNV-1 hash. This hash is calculated iteratively, applying a multiplication and XOR operation to each byte.
uVar21 = *(uint *)(lVar53 + (ulong)uVar74);
uVar21 = uVar21 ^ uVar75 ^ 0xffffffff;
....
...
uVar50 = 0xcbf29ce484222325;
do {
    pcVar26 = (char *)(lVar53 + (ulong)(uVar72 - uVar21 * uVar75) + lVar44);
    lVar44 = (long)iVar63;
    iVar62 = iVar62 + -1;
    iVar63 = iVar63 + 1;
    uVar50 = uVar50 * 0x100000001b3 ^ (long)*pcVar26;
} while (iVar62 != 0);
The computed hash is then compared to a reference value stored in memory. If the hash matches, the extracted key is considered valid, and execution continues. If the validation fails, the execution is redirected to an alternative path.
if ((uVar50 ^ (long)*(int *)(**(long **)(local_308 + 0x88) + (ulong)(uVar70 - uVar21 * uVar75)))
    != uVar59) {
    uVar22 = uVar76;
}
This conditional check ensures that only validated keys are utilized in the execution process.
You can examine what this analysis looks like in code by examining this repo, which has developed and tooled all the implementations we have mentioned so far in the Rust language. When you extract all the strings in the target bytecode files with the help of this tool, you may encounter interesting things. For example;
0x06: Final
PairIP, separates the Java bytecodes found in the target application from the normal application flow and transforms them into bytecode sequences compatible with Google’s custom VM. These transformed bytecodes are executed by the executeVM() native method, which is registered via RegisterNatives in the libpairipcore.so library. This approach enhances security and ensures execution integrity.
Although the PairIP VM is designed as a stack-based virtual machine, it does not fully adhere to a traditional stack-based architecture. Instead, it operates directly on memory, making it a hybrid execution model.
Additionally, PairIP utilizes the FNV-1 hash algorithm to verify the opcodes it executes. Since the opcode table is dynamically regenerated with each compilation, developing a universal decoding method is not feasible.

There are definitely more details to investigate. But this is all I have time for. Hopefully someone will come up with more interesting details so we can learn more.
You can also access the frida script file used in the article from the Gist link.
https://gist.github.com/Ahmeth4n/8b0a21228fc2437864bb58b9402180ad
Useful Links:
https://www.synthesis.to/2021/10/21/vm_based_obfuscation.html
https://en.wikipedia.org/wiki/Fowler%E2%80%93Noll%E2%80%93Vo_hash_function
https://github.com/MatrixEditor/pairipcore-vm/
https://github.com/Solaree/pairipcore
https://www.romainthomas.fr/publication/22-sstic-blackhat-droidguard-safetynet/
https://www.youtube.com/watch?v=zcFg0ZJ2E_A
